Looking to get your product in front of thousands of creatives?
My audience isn’t just here for the vibes (though we’ve got plenty) they’re here to learn, grow, and invest in their creative businesses. That means your product, service, or course could be the exact thing they’re searching for.
test the waters with a Story Shoutout first
Not ready to go all-in yet? Start with a 3-part Instagram Story series to test the waters and see the kind of results I can get you.
What you get:
3 Instagram Story slides featuring your product, service, or offer
I’ll start with a poll or question box to gauge interest and spark engagement
Then I’ll showcase your promo with your provided content or a custom walkthrough
Each slide includes a UTM-tracked link so you can see exactly how much traffic and signups my shoutout brings
This is perfect for:
Creative software, coaching programs, digital tools, handmade goods, print services, or courses made for creatives.
Brands looking to build awareness and get direct feedback from real creative entrepreneurs.


see my media kit
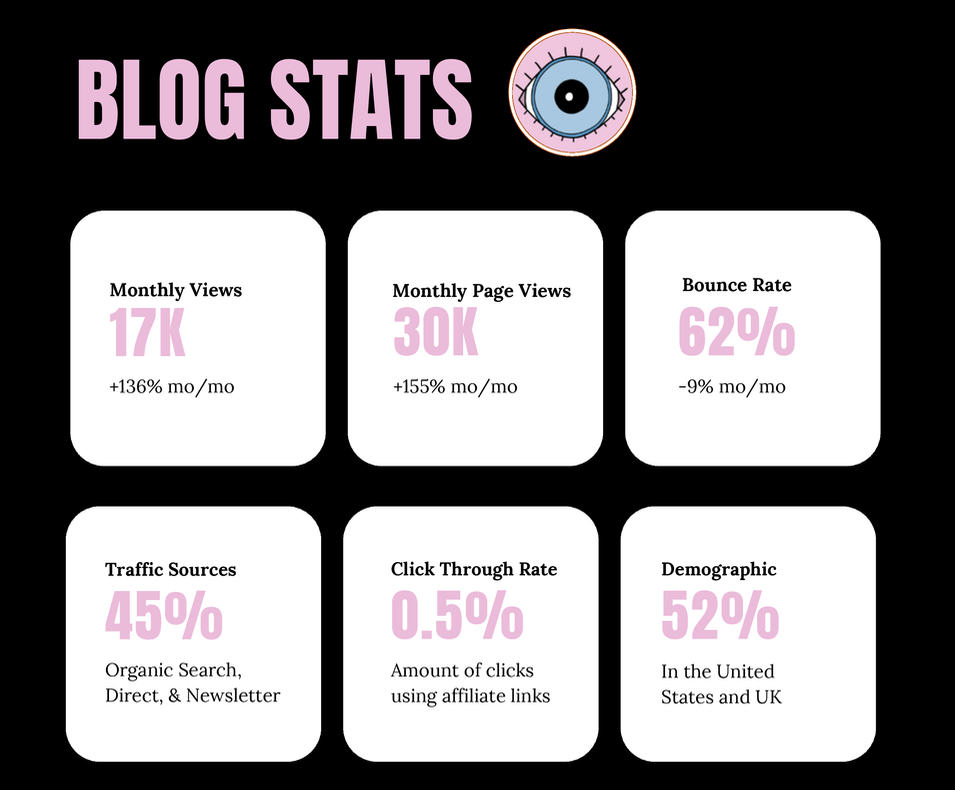
Want all the stats, pricing, and details on my content strategy? Download my full media kit below. You’ll find:
My sponsorship packages
Audience demographics + engagement rates
Examples of brands I’ve shouted out
Results from past campaigns
My cross-platform reach on Instagram, Threads, TikTok, and more

still have questions?
dina@womenofillustration.com